Diesel Price Risk in a Disrupted Oil Market: What Shippers Should Know

For more than a week, Iran has sustained attacks by the US and Israel over concern of Iran’s nuclear stockpiles. Oil prices remained relatively stable despite the fighting until Iran announced that it would attack any ship passing through the Strait of Hormuz, the all-important passage used for global oil trade.
On Sunday, the markets began to restrict due to the extent of the implications. The price of oil jumped from about $92 on Friday afternoon to $119.50 on Sunday, a nearly 30% increase. As of 6 pm on March 9, the price per barrel rebounded back down to $90 per, likely due to President Trump’s comments on CBS that day that the war was “very complete”. Additionally, the G7 finance ministers acknowledging their readiness to release oil from strategic reserves, if needed. In the meantime, the markets will be closely monitoring any additional escalations in the region.
Decreased Capacity
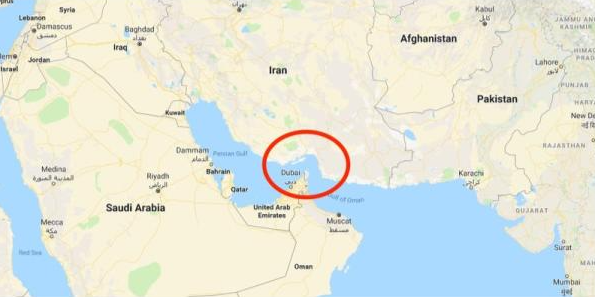
The Strait of Hormuz, which is a narrow stretch of water nestled between Iran, Saudia Arabia, Bahrain, Qatar, Oman and Pakistan, serves as the chokepoint of the world’s oil supply. Roughly 21 million barrels, or $1.2B in oil pass through the straight every day. That equates to an average of 138 ships on a normal business day, but with the recent strikes, the number of daily ships making the voyage has decreased to single digits.
Diesel Cost Implications
The U.S. Energy Information Administration (EIA) publishes the national diesel cost per gallon average every Monday afternoon. The retail price of a gallon directly correlates to the costs and profits of producing and delivering it. The inputs that define the four primary diesel cost components are:
- The refinery’s cost for purchase of crude oil
- Refining costs and profits
- Distribution, marketing, and retail costs
- Taxes
Analysis & Outcomes
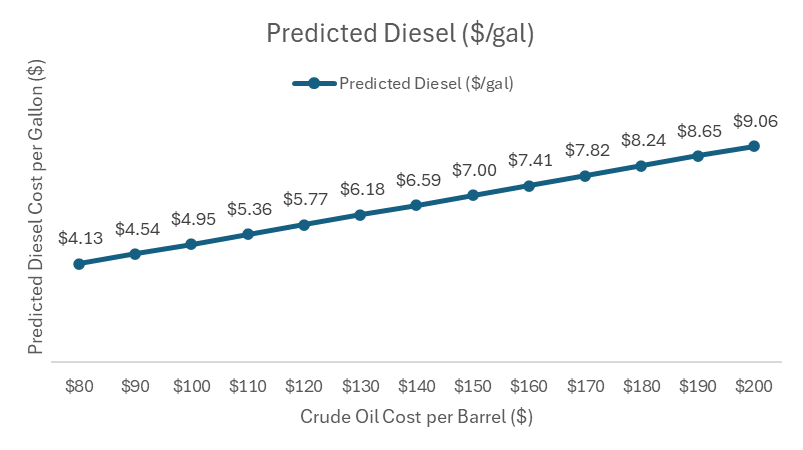
To better understand market volatility and its implication on the diesel forecast, we used linear regression modeling using January 2021-March 2026 EIA diesel data and matched it to the WTI Cushing spot price ($/barrel) and isolated diesel as the dependent variable. Our goal was to extrapolate the impact in $10 increments up to $200 per barrel.
68% of the diesel cost is explained by crude prices alone. Other factors include transportation, marketing, taxes, profit, and other fees. What we found was that each $1 rise in crude oil corresponds to an ~$.04 increase in diesel, or $.41 for every $10. Using this logic, values rise linearly to $9.06/gal once crude hits.
Appendix – Full Methodology and Sources
Data & Methodology
Crude Oil: WTI Cushing Spot Price ($/barrel) from PET_PRI_SPT_S1_D.xlsx (Data 1). Diesel: Weekly U.S. No. 2 Diesel Retail Price ($/gallon) from psw18vwall.xlsx (Data 1). Timeframe: January 2021 – March 2026. Observations: 236 matched weekly data points. Method: Simple correlation and linear regression (diesel as dependent variable).
Key Findings
Strength of Relationship: Pearson correlation of 0.82 indicates a strong positive relationship; R² of 0.68 shows about 68% of diesel price movement is explained by crude prices alone. Price Pass-Through: Estimated model: Diesel Price ($/gal) = 0.041 × Crude Price ($/barrel) + 0.838. Interpretation: each $1 rise in crude oil corresponds to about $0.041 increase in diesel (or ~$0.41 for every $10). Forecast Using the historical relationship, the implied diesel prices for increments in crude oil are shown below: These values rise linearly given the simple model; at $200/barrel crude the model implies ~9.06 $/gal diesel. Crude ($/bbl) Predicted Diesel ($/gal) 80 4.13 90 4.54 100 4.95 110 5.36 120 5.77 130 6.18 140 6.59 150 7.00 160 7.41 170 7.82 180 8.24 190 8.65 200 9.06
Business Implications
Diesel prices exhibit high sensitivity to crude moves, making crude a strong leading indicator for fuel cost planning. A sustained $50 increase in crude implies roughly $2.00/gal upside risk to diesel. Useful for fuel surcharge forecasting, budget stress testing and scenario planning. Important Considerations This is a linear extrapolation beyond historical crude range (data max ~121 $/bbl). At extreme levels, real-world diesel pricing may deviate due to refining constraints, demand effects and regulation; use for directional risk planning, not exact prediction. Bottom Line Since 2021 U.S. diesel prices have closely tracked crude oil, permitting a simple model to quantify exposure. Should crude reach $200/barrel, the model suggests ~9 $/gal diesel—a material cost risk for transportation and logistics
Sources